Hooke’s
Law – Computer Applications Assignment 1
Hooke’s Law is the law of elasticity discovered by Robert Hooke in 1660, which
states that, for relatively small deformations of an object, the displacement
or size of the deformation is directly proportional to the deforming force or load.
(1)
Deformation of a solid is caused by a force that can either
be compressive or tensile when applied in one direction. Compressive forces try to compress and object
while tensile ones try to tear it apart. We can study these effects by looking
at what happens when you compress or extend a spring. (2)
The equation which relates deformation to load is written
as;
F=-kx (Equation 1(3))
In equation 1, F is equal to the force applied; k is the
spring constant of the material and x is the amount of displacement observed.
When plotting a graph of load against displacement, a linear
relationship is observed.

(Figure 1 (2))


(Figure 2 (2))
(Figure 3 (2))
Figure 2 shows the relationship between force and extension
for a strong, brittle material. There is very little extension for a large
force, but the material suddenly breaks and fractures. It is defined as being
brittle because the material fractures instead of bending. An example of a brittle material is glass. (2)
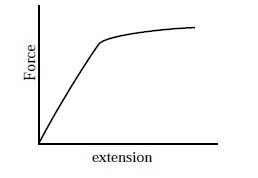
Figure 3 shows the relationship between force and extension
for a plastic material. The material undergoes a large deformation with only a
little force applied. The linear relationship of Hooke’s Law only lasts for a
short time. It is defined as being plastic because it is more likely to bend
than to fracture. (2)
(Figure 4 (2))
Figure 4 shows the relationship between force and extension
for a ductile material. The material shows the behaviour of a plastic material,
after Hooke’s Law has been exceeded, over a range of forces before
fracturing. Ductility is the ability of
a material to be stretched into a new shape without breaking. An example of a ductile material is aluminium. (2)
Most Hooke’s Law experiments are carried out by hanging
weights onto a spring and recording how much they extend by. Here is a video demonstrating how to set up and conduct a Hooke's Law experiment.
Figure 5 shows how when the force acting on the spring doubles, the spring's extension also doubles.

(Figure 5 (5))
Here are a few videos
which explain Hooke’s Law and what to expect from a force and displacement
graph.
The following results were obtained from a Hooke’s Law
experiment.
x
|
y1
(Material 1)
|
y2
(Material 2)
|
z
(Material 3)
|
1
|
3
|
2.2583
|
2.375
|
2
|
4.5
|
4.3166
|
9.375
|
3
|
6
|
6.3749
|
28.375
|
4
|
7.5
|
8.4332
|
65.375
|
5
|
9
|
10.4915
|
126.375
|
6
|
10.5
|
12.5498
|
217.375
|
7
|
13
|
14.6081
|
344.375
|
8
|
14
|
16.6664
|
513.375
|
9
|
15
|
18.7247
|
730.375
|
(Table 1)
In table 1, x is the amount of force applied in Newtons, and
the values shown in the material columns show the amount of deformation in the
material in mm. When plotting materials
1 and 2 on a graph, a trend becomes evident.

(Figure 6)
Figure 6 shows, that both materials have a linear
relationship with force and extension. This means that Hooke’s law is being
obeyed throughout all points of the experiment. This also implies that, once
the load is removed, the material will return to its original shape. Also, as
the relationship is linear, they both follow equation 4 which is the equation
of a straight line.
Y=mx+c (Equation 4)
Using equation 4, it is possible to work out the gradient of
the slope and also the y intercept. In equation 4, the gradient of the slope is
equal to m and the y intercept is equal to c. In this case, the gradient is a
constant and is also equal to the spring constant of the material itself. Equation
2 shows the spring constant for material 1 as being 1.5583 Nm-1.
Equation 3 shows that the spring constant for material 2 as being 2.0583 Nm-1.
The y intercept shows the force applied when displacement is
zero. It is to be expected that the y intercept for Hooke’s law will be equal
to zero. That is to say, that when there is zero force applied, zero
deformation is observed. However, as can be seen from equations 2 and 3, there
is a value of 0.2 and 1.375 respectively. These values obtained for the y
intercept is due to choosing a line of best fit from the data collected.
It is also possible to use the graph in figure 6 to show the
point where the force-extension relationships for both materials intersect each
other. It is at this point where both materials will extend by the same amount
when the same force is applied to them. According to the graph this occurs at
roughly 2.3N. This can also be attained by using the laws of simultaneous
equations to equations 2 and 3 in the following way.
First arrange the equations together as equation 2 is equal
to equation 3 to get equation 5;
2.0583x + 0.2 =
1.5583x + 1.375 (Equation 5)
Next, make x the subject of equation 5 to get equation 6;
2.0583x – 1.5583x
= 1.375 – 0.2 (Equation 6)
Next, do the subtraction on both sides of the equation to get
equation 7;
0.5x = 1.175 (Equation
7)
Finally divide both sides of equation 7 by 0.5 to leave
equation 8;
X = 2.35 N (Equation
8)
The value which appears on figure 6 is very close to the
value obtained in equation 8. It is not identical due to the graph in figure 6
not being presented in enough detail to gain an exact reading of where the
intersection takes place.

(Figure 7)
References
1.
Unknown. (2012). Hooke's Law. Available:
http://www.britannica.com/EBchecked/topic/271336/Hookes-law. Last accessed 12th
Nov 2012.
2.
Unknown. (6th Oct 2009). What Is Hooke's Law?. Available:
http://engineers4world.blogspot.co.uk/2009/11/hookes-law.html. Last accessed
12th Nov 2012.
3.
Unknown. (2012). Determine The Spring Constant. Available:
http://www.4physics.com/phy_demo/HookesLaw/HookesLawLab.html. Last accessed
12th Nov 2012.
4.
QuantumBoffin. (7th Nov 2009). Stretching a Spring. Available:
https://www.youtube.com/watch?v=OHyfoM2vIUs&feature=related. Last accessed
13th Nov 2012.
5.
Nave, R. (Unknown). Elasticity
- Hooke's Law. Available:
http://hyperphysics.phy-astr.gsu.edu/hbase/permot2.html. Last accessed 13th Nov
2012.
6.
Fullerton, D. (29th Nov 2011). Springs
and Hookes Law. Available:
http://www.youtube.com/watch?v=6MhaPzGxfV8&feature=related. Last
accessed 13th Nov 2012.